
Read Order Flow Clearly with Indepth Data – Even in Fast Markets
A next-generation order-flow presentation that reveals micro-momentum and delta shifts in real time, without lag, freezes, or Tick Replay.
Why Order Flow still fails you in fast markets?

Lack of true depth
Traditional order flow shows bid/ask, delta, and basic footprints – but it doesn’t reveal micro-momentum, intra-bar delta shifts, or true imbalance layers needed for professional decisions.You see totals, not how the battle unfolded at each price.

Tick Replay turns high volatility into latency
During high volatility, legacy order-flow tools start breaking down:
Tick Replay slows the chart, freezes the footprint, and introduces delay exactly when price accelerates.Your chart becomes a bottleneck – not a source of insight.

Too much data, no clear signal
Even when everything loads, you face another problem:Too many numbers. Too many colors.Too much noise – with no clear logic showing what truly matters.
You've probably tried...
Switching footprint layouts. Adding more filters. Using more tools to “interpret” delta.
None of them solve the core issue – they just reorganize the same incomplete data.
Order Flow itself isn’t the issue!
The missing piece is a microstructure presentation that is:
Deeper
Faster
Cleaner
It eliminates lag, exposes real-time delta shifts, and highlights important price layers without overwhelming you.
Introducing...
Order Flow Presentation v2
The next evolution in professional order-flow analysis
Rebuilt by ZignalAlgo Research, Order Flow Presentation v2 standardizes how traders read microstructure, enhances stability, reduces latency, and improves interpretability across all market conditions.At the core of v2 is the Microstructure Clarity Engine, a proprietary analytical framework that:

Eliminates Tick Replay entirely

Processes footprint data through a high-speed pipeline

Re-encodes Delta using a multi-layer OHLC model
Analyzes order-flow along 2 axes (time × price)
Reveals hidden imbalances & liquidity pressure
The foundation of this indicator...
...rests on an essential principle of market microstructure:Price doesn’t move by raw numbers – it moves on hidden asymmetry.Markets shift only when asymmetry appears – in Delta, Absorption, Aggression, or Response.These are the signals that drive meaningful change, yet traditional footprint tools rarely isolate them.With Order Flow Presentation v2, you move beyond raw data. You see the market’s internal structure – clear, immediate, and actionable!


Real-time footprint, no Tick Replay
A footprint is only as good as the speed and stability behind it.
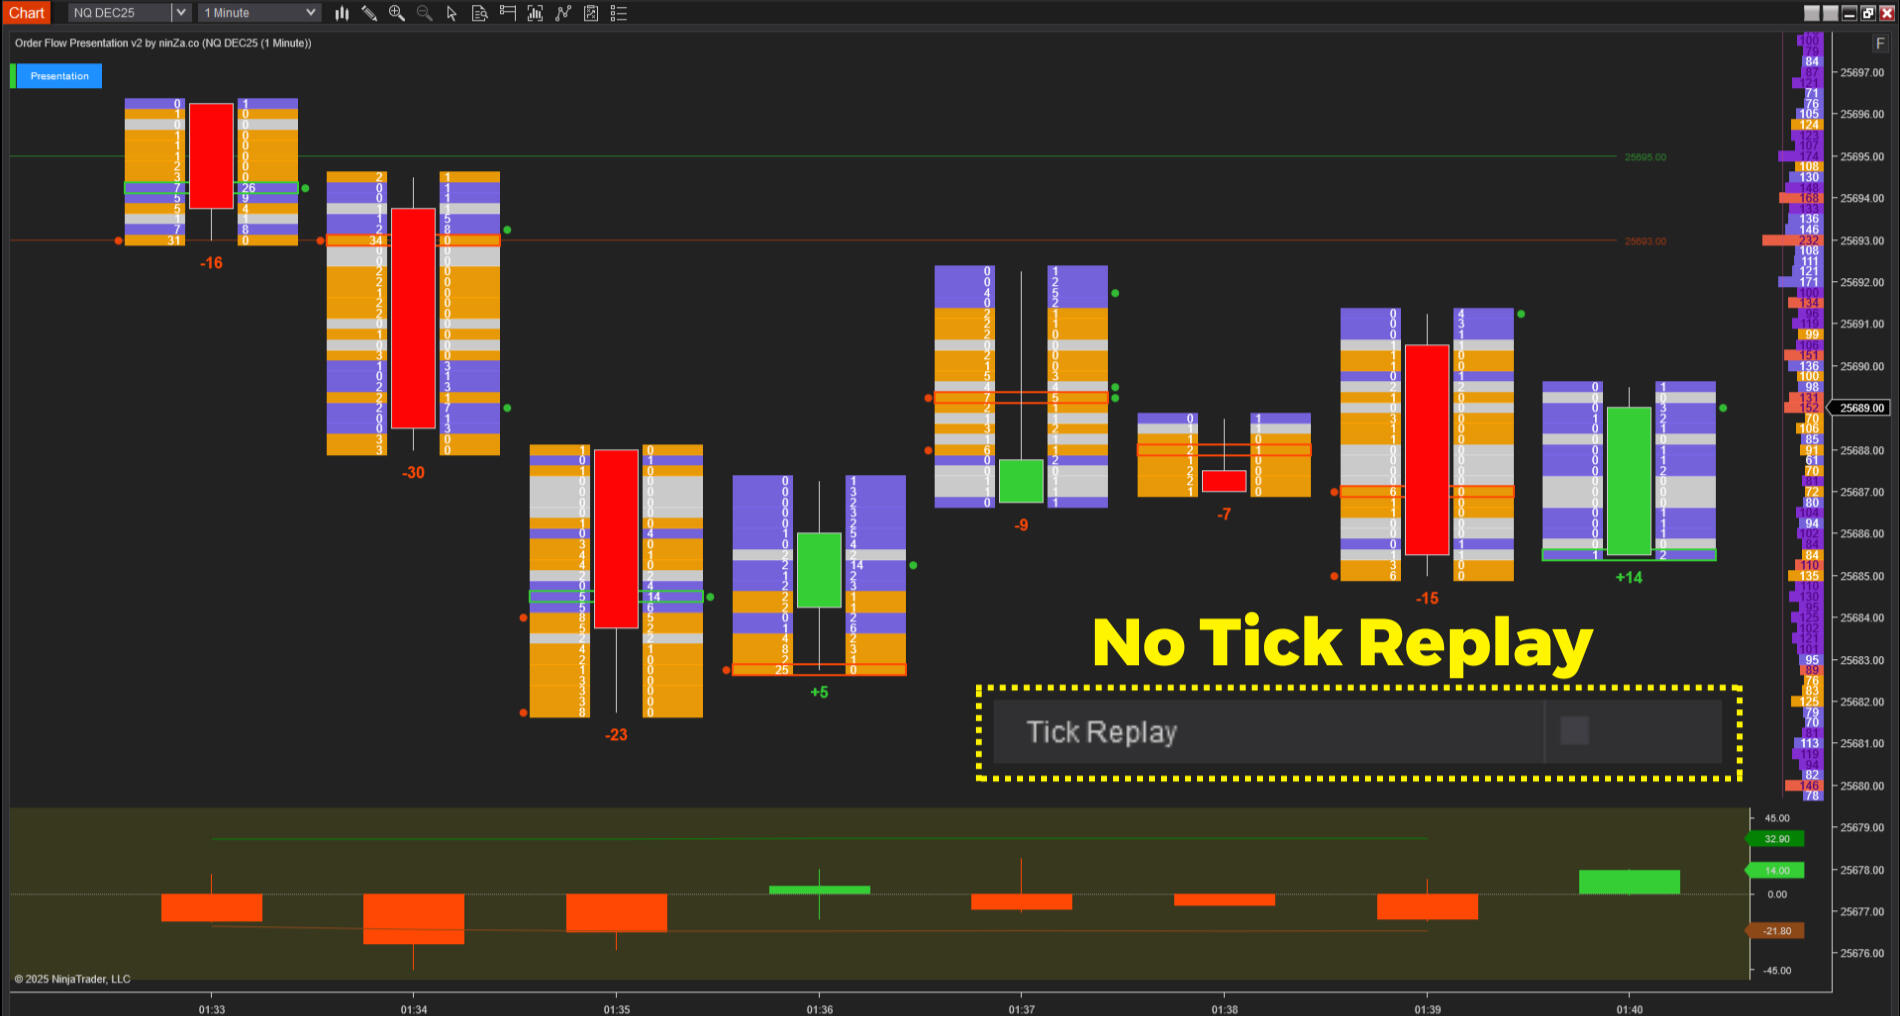
Order Flow Presentation v2 introduces a new data-processing engine that removes Tick Replay entirely.Instead of reloading historical ticks, the engine processes incoming order-flow directly and updates the footprint almost instantly.What’s improved:
Tick Replay fully removed
Faster, smoother footprint rendering
Near real-time updates in all market conditions
Stable performance under heavy data load
Effect on chart performance:

No footprint freezes

No slowdowns during high-volume bursts

No missed micro momentum from chart delay

A more predictable & smoother chart experience
3 Advancements in v2 that redefine Order Flow reading


Delta OHLC Chart
Version 2 expands delta beyond the traditional Open–Close model into a full OHLC structure for every candle:
Delta High
Delta Low
Delta Open
Delta Close
This full-range mapping reveals the push–pull between buyers and sellers inside each bar, uncovering micro-momentum that raw delta can’t capture.With OHLC Delta, you can quickly interpret:
Internal strength or weakness of the move
Absorption vs. Aggression at key moments
Shifts in micro-momentum as they happen
Statistical Average Baselines
Version 2 plots key statistical baselines for both Volume & Delta:
Average Volume
Average Positive Delta
Average Negative Delta
Baselines can be displayed per candle or for the entire trading day, helping you:
Distinguish meaningful signals from noise
Spot unusual spikes or anomalies in order-flow
Gauge the true strength behind each price movement
This approach mirrors how professional desk traders evaluate “true activity vs market noise”.


Multi-dimensional Delta in Time & Price
For the first time on NinjaTrader 8, you can observe delta in 2 dimensions:
Horizontal (Time Axis) – follow delta changes bar by bar to detect:
Divergence & exhaustion
Inflow/outflow patterns
Aggressive shifts between buyers and sellers
Vertical (Price Axis) – map delta at every price level within each candle & across the day, revealing:
Significant price-level imbalances
Absorption or rejection at liquidity layers
The internal structure of the footprint, not just total delta
Delta levels that exceed the average are automatically highlighted, so you can:
Quickly identify liquidity-hunting points
Spot strong or weak zones for buyers and sellers
Easily identify zones of significant delta imbalance
Real ways to put these insights into action
Practical, chart-ready situations that demonstrate absorption, imbalance, momentum shifts, and more.


Order Flow Presentation v2 shows you where imbalance, absorption, and micro-momentum form.
Innovative Ordering ensures you can execute at those exact moments – without delay or friction.This matters because in fast markets:
The best entries appear briefly
Hesitation costs ticks
Misclicks cost trades
Innovative Ordering is built for these moments.
One-click market orders with oversized Buy/Sell buttons
One-click pending orders (LMT, MIT, STP, SLM) at precise price levels
Faster reaction during absorption breaks, delta shifts, and liquidity tests
Cleaner execution when timing matters most
Together, they create a complete workflow:
Read microstructure → Confirm pressure → Execute instantly
Add effective trade location to your Order Flow reads
Order Flow Presentation v2 shows how pressure builds in real time – through delta shifts, absorption, and micro-momentum.Imbalance Profile Lidar defines where that pressure becomes tradable by automatically mapping volume concentration, imbalance phases, and value areas.This matters because order flow without location is incomplete.
Together, you move from:
“Delta is shifting”
to
“Delta is shifting inside a proven value zone – this matters.”That’s how raw order-flow data becomes structured, high-probability execution context.


Extra useful trading tip
How to read and analyze based on Delta divergence on each candle when price reacts at the levels: yPOC, POC, yHigh, and yClose.


When Futures Traders use it LIVE!
See how traders are using Order Flow Presentation v2 in live markets – across different styles, instruments, and conditions.
This video showcases a live GC trading session with Order Flow Presentation v2, focused on reading order flow at the candle wicks, resulting in 20 trades total, with just 1 losing trade.
This video demonstrates live scalping trades executed purely based on Order Flow, with each entry clearly explained. The session focuses on real-time decision-making and includes only 1 losing trade.
In this LIVE trading video, our pro trader Harry Lee has executed 4 trades based on the checklist from Practical Uses session:
Read genuine feedback from our pro traders:


Worried about complexity, lag, or noise?
Order Flow Presentation v2 tackles every common issue that stops traders from using order flow effectively.
Wanna enjoy amazing 2026 offers ??
Core Power offer
(1) Order Flow Presentation v2 lifetime license: $1,300 value
Free upgrade to v2.1 (Jan 2026): $700 value
World-class support service: $100 value
Trader's manual: $400
In total: $2,500
Now only...
$426
Instant Execution bundle
(1) Order Flow Presentation v2 lifetime license: $1,300 value
Free upgrade to v2.1 (Jan 2026): $700 value
(1) Innovative Ordering lifetime license: $500 value
World-class support service: $200 value
Trader's manual: $800
In total: $3,500
Now only...
$596
Basically, you just need to stretch $50 more for extra huge value...
Best deal: Perfect Duo
(1) Order Flow Presentation v2 lifetime license: $1,300 value
Free upgrade to v2.1 (Jan 2026): $700 value
(1) Imbalance Profile Lidar lifetime license: $600 value
World-class support service: $200 value
Trader's manual: $800
In total: $3,600
Now only...
$626
Basically, you just need to stretch $70 more for extra huge value...
Your purchase is fully protected
Zero Risk. Full Peace of Mind.Trade with the full indicator for 30 days – your charts, your markets, your strategy.If it doesn’t noticeably improve your timing, clarity, or trade quality, we’ll exchange it for any other indicator with little or no fee.

See the Market’s Internal Structure – Starting Today
You’re accessing Order Flow Presentation v2 at an early-stage price. Once the framework is fully completed, pricing will rise to approximately $2,000.
Quick-start guide: Everything you need to start using it within minutes